
App Store Keyword Ranking Statistics: Why Rankings Decide Your Downloads (2026)
Apple says almost 65% of App Store downloads happen directly after a search, and the top search result gets roughly 10x the taps of position 3. The data behind why keyword rankings matter, with sources.
Quick answer: Almost 65% of App Store downloads happen directly after a search, and 70% of App Store visitors use search to discover apps, per Apple's own published numbers. Position decides who gets those downloads: SplitMetrics measured an average tap-through rate of 28.4% for the #1 search result, falling to 6.2% at #2, 2.7% at #3, and under 1% from position 6 down. In practice, the top result collects roughly twice as many taps as positions 2 through 9 combined. If your app doesn't rank in the top handful of results for keywords people actually search, it doesn't meaningfully exist in App Store search.
Every ASO guide tells you keyword rankings matter. Almost none of them show the numbers, so the advice reads like folklore. This post is the evidence layer: the published research on how much App Store search drives downloads, how steeply taps fall off by position, and what that means for where you spend your optimization time. Every stat links to its source so you can check it yourself.
Search is where App Store downloads come from
The strongest numbers here come from Apple itself, published on the Apple Ads page for the App Store:
- 70% of App Store visitors use search to discover apps.
- Almost 65% of downloads happen directly after a search.
- Ads shown at the top of search results convert at over 60% on average, which tells you how high-intent that surface is even before organic rankings enter the picture.
Independent measurement backs this up. Sensor Tower's download-source analysis put search at nearly 60% of global App Store downloads, and their earlier study found the share is even higher for non-game apps (69%) than for games (56%) (Sensor Tower, 2018).
Browse features, charts, and editorial placements get the attention in marketing conversations. The download volume is in the search box.
The tap-through cliff: position 1 versus everyone else
Knowing search drives downloads is only half the argument. The other half is how brutally those taps concentrate at the top. SplitMetrics measured average tap-through rate (TTR) by organic search position and found a cliff, not a slope:
| Search position | Average tap-through rate |
|---|---|
| 1 | 28.38% |
| 2 | 6.15% |
| 3 | 2.66% |
| 4 | 1.36% |
| 5 | 1.22% |
| 6-9 | under 1% each |
Read that table again. Position 1 gets about 4.6x the taps of position 2 and over 10x position 3. Sum positions 2 through 9 and you get roughly 15%, which means the single top result out-collects the next eight combined by about 2 to 1.
Two practical consequences fall out of this:
- Ranking #50 on a big keyword is worth nothing. Not "a little", nothing. The taps ran out forty positions earlier. A #3 rank on a specific long-tail phrase beats a #50 rank on a head term every time, which is exactly why our keyword research walkthrough tells you to sort by opportunity instead of raw demand.
- Small rank movements near the top are worth more than big movements further down. Going from #8 to #4 roughly doubles your tap share. Going from #80 to #40 changes nothing. This is why the keywords you already rank #11-30 on are the cheapest wins in ASO: you're within pushing distance of the part of the curve where taps actually exist.
Rankings are a moving target, which is why tracking exists
A rank is not a fact you establish once. Competitors ship metadata updates, Apple re-weights terms, and seasonal search behavior shifts demand. The apps that win search treat rankings as a weekly metric, not a launch-week checkbox: measure, change one variable, wait for re-indexing, measure again. Our ASO checklist builds that loop in as step 18 for exactly this reason.
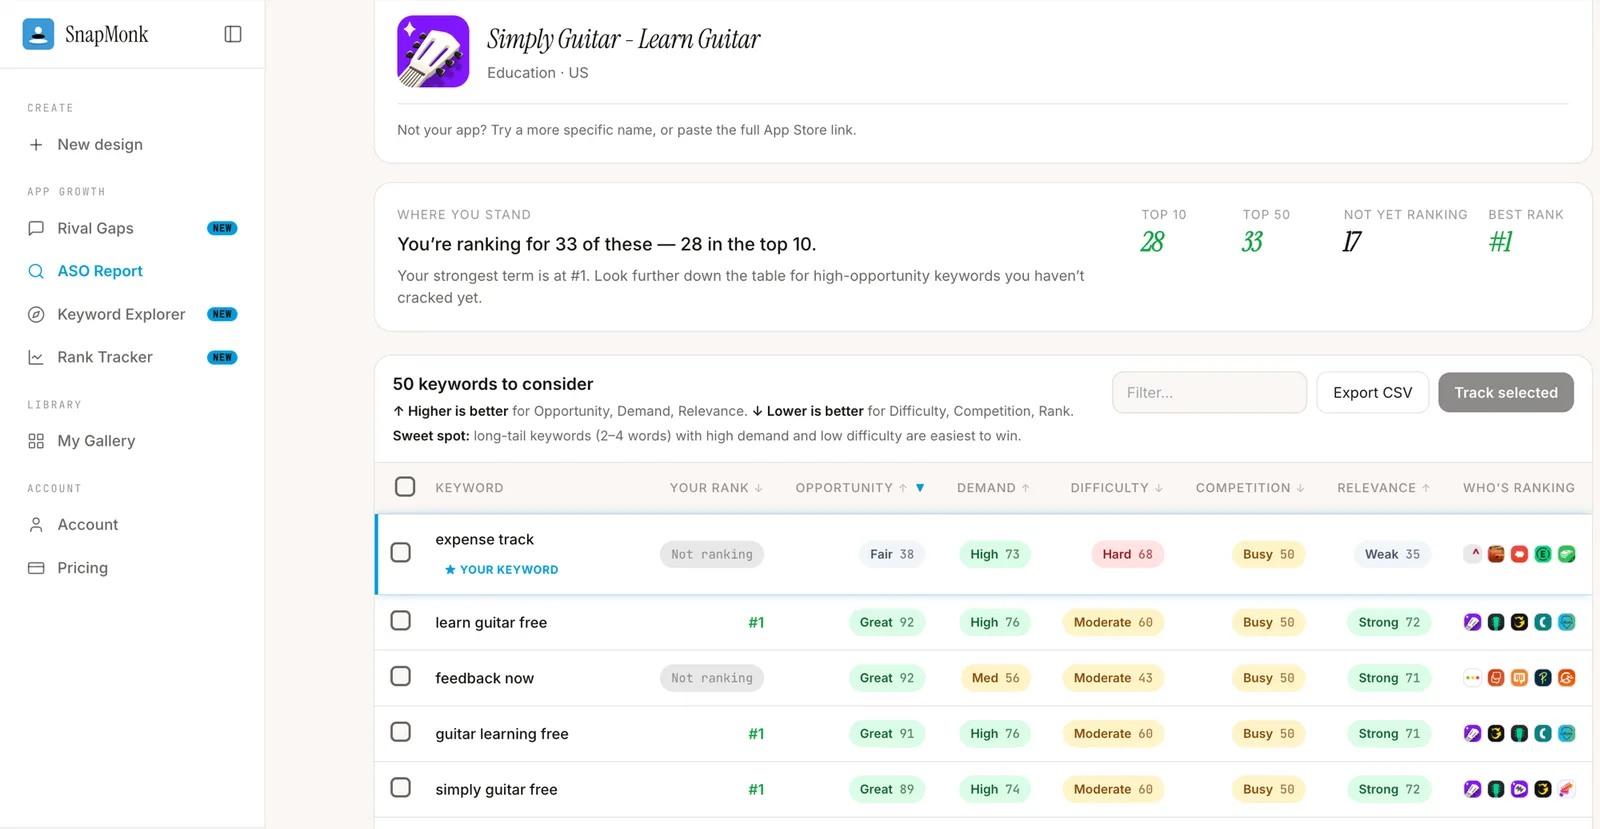
If you want to see where you stand right now, run a free ASO report on your own App Store listing. It returns ~50 keyword ideas scored by demand, difficulty, and opportunity, with your live current rank on each, so the "#11-30 push zone" above stops being abstract. To dig into a single term, the Keyword Explorer shows any keyword's popularity, competition, and the apps currently holding those top positions.
After the tap: the ranking gets you seen, the listing gets you installed
One honest caveat, because this data gets misused. Tap-through is not install. A top-3 rank puts your icon, title, and screenshots in front of the searcher; whether they tap and then install depends on how that listing looks against the two apps beside it.
That conversion layer is measurable too. Our State of App Store Screenshots 2026 report analyzed 1,499 top free iPhone apps and found the listings winning these high-value positions treat screenshots as conversion assets: portrait-first galleries, captioned frames, and regular iteration rather than launch-and-forget. Ranking work and listing work compound; either one alone leaves downloads on the table. When the ranking side is in motion, the screenshot side is the next lever.
Sources
- Apple Ads: Advertise on the App Store (70% of visitors use search; almost 65% of downloads follow a search; 60%+ conversion for top-of-search ads)
- SplitMetrics: Tap-Through Rate in App Store Search (average TTR by organic position)
- Sensor Tower: App Store download sources, 2021 report (search share of global downloads)
- Sensor Tower: downloads from search by app type, 2018 (games vs non-games split)
- SnapMonk: State of App Store Screenshots 2026 (listing composition of 1,499 top free iPhone apps)
Stats worth quoting? Take them, and cite the primary source above (or this page for the synthesis).
FAQ
What percentage of App Store downloads come from search? Almost 65% of App Store downloads happen directly after a search, according to Apple's published Apple Ads figures, and 70% of App Store visitors use search to discover apps. Independent Sensor Tower measurement puts search at roughly 60% of global App Store downloads, higher for non-game apps.
Do App Store keyword rankings really matter? Yes, and the effect is steeper than most developers assume. SplitMetrics measured an average tap-through rate of 28.38% for the #1 organic search result, 6.15% for #2, 2.66% for #3, and under 1% from position 6 down. An app ranking outside the top 10 on a keyword receives almost none of that keyword's taps.
What is a good tap-through rate on the App Store? It depends almost entirely on position. The #1 search result averages around 28% tap-through, #2 around 6%, and #3 under 3%, so judge your TTR against your rank rather than against a single global benchmark. If your TTR is far below the average for your position, the icon, title, and first screenshots are the usual suspects.
How do I check my app's keyword rankings? Paste your App Store URL into a free ASO tool like SnapMonk's ASO report to get your live rank across ~50 relevant keywords, scored by demand, difficulty, and opportunity. Prioritize keywords where you already rank #11-30, since those are closest to the positions where taps actually concentrate, and re-check weekly after metadata changes.
Related reading
- App Store rank tracker: how daily per-country rank snapshots work, and the two limits every ASO tool shares
- How to run ASO keyword research in 5 minutes: the workflow for acting on these numbers
- Title vs subtitle vs keyword field: where each keyword belongs once you've picked it
- The ASO checklist: 20 steps: keywords, metadata, visuals, and the weekly tracking loop
- State of App Store Screenshots 2026: our own dataset on the conversion side of the listing
Keep reading
Back My Side Review: The ASO Tool That Shows Its Work (2026)
A hands-on look at Back My Side, the App Store keyword and rank-tracking tool built on Apple's public data instead of invented volume scores. What it does, what it costs, where it fits next to SnapMonk ASO.
Read articleThe App Growth Loop: Pick Keywords, Test Screenshots, Track Ranks (2026)
A repeatable app growth strategy for small teams: find keywords you can actually win, test screenshot variants one variable at a time, and watch daily rank data tell you whether it worked.
Read articleHow to Pick App Store Keywords Before You Have Any Downloads
Pre-launch keyword research has no install data to learn from. Here is how to source candidates, judge which terms you can actually win, and spend your 30/30/100 character budget on a brand-new app.
Read articleReady to AI-generate your app screenshots?
Describe your app, get store-ready visuals in seconds. Try SnapMonk free — no signup required.
Try the AI Engine